Economics & Finance Data Stories
Foreign Trade Performance Analysis: Leading 25 Countries by Product
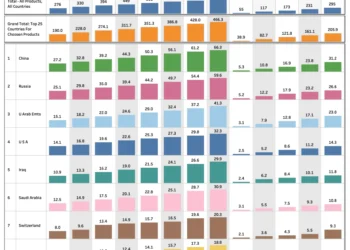
This chart provides a detailed analysis of foreign trade performance, highlighting the top 25 countries importing selected products from India.

Electronics Trade Dashboard: Imports, Exports Trends
This dashboard presents trends in imports, exports, surplus, and deficit for principal electronics commodities across various time periods.
Foreign Trade Performance Analysis: Leading 25 Products by Country
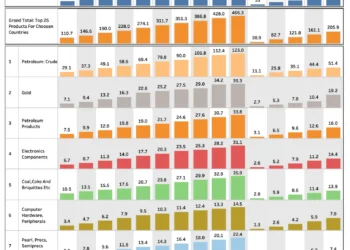
This chart lists the top 25 products of selected countries, viewable across various time scales.
Indian GST Collections Trends: Summary & State Wise Break Up
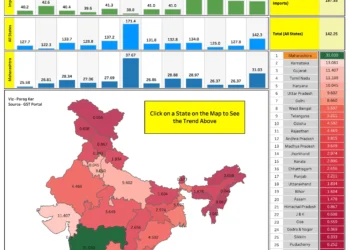
The chart provide a comprehensive view of India's GST collection and refunds, broken down by states.
India’s Foreign Trade Oil & Non-Oil : Summary & Trends
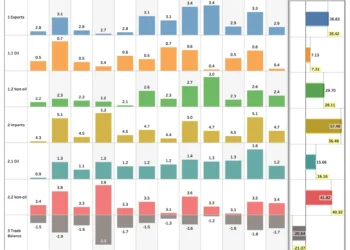
This visualization presents a monthly analysis of India's trade in goods, categorized into energy (oil) and non-energy (non-oil) items.
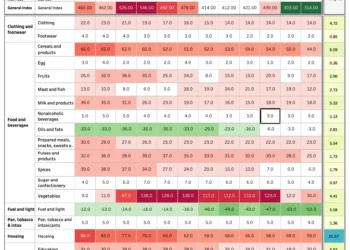
Indian CPI Inflation Trends: Urban, Rural & Combined
This chart provides a comprehensive overview of India's CPI inflation trends across major categories like housing, food, and transportation etc.
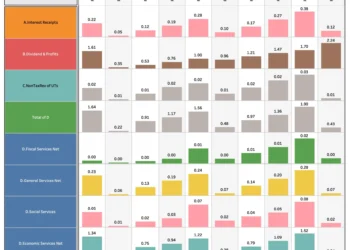
Government of India Non-Tax Revenue: Summary and Trends
This chart provides a detailed analysis of the Government of India's non-tax revenue trends categorized by various components.
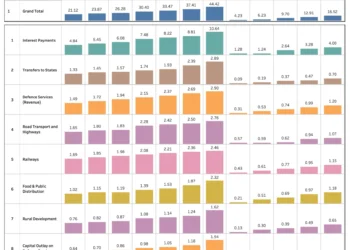
Government of India Capital & Revenue Expenditure: Summary and Trends
This chart provides a detailed trend analysis of the central government's revenue and capital expenditure, covering key areas.
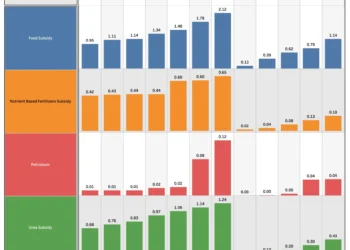
Government of India Major Subsidies: Summary and Trends
This chart showcases the cumulative trends in major subsidies provided by the central government, including food, fertilizer, petroleum etc.
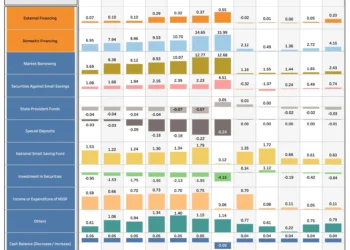
Government of India Deficit Financing: Summary and Trends
This chart provides a cumulative analysis of the central government's financing patterns, covering domestic and external financing, market borrowing etc.