Economics & Finance Data Stories
SLT Table 2: Foreign Long-Term Securities Held by U.S. Residents – Analysis of Corp Stocks, Bonds, and Total Holdings
This interactive dashboard presents the U.S. Treasury International Capital (TIC) SLT Table 2 data, showcasing the foreign long-term securities held...
SLT Table 1: U.S. Long-Term Securities Holdings by Foreign Residents – Trends in Net Sales, Valuation Changes, and Security Types
This interactive dashboard provides a comprehensive view of U.S. long-term securities held by foreign residents.
Standard Presentation of BoP in India as per BPM6: Trends Capital, Current & Other Accounts (Set of Two Charts)
This dashboard presents India's Balance of Payments (BoP) as per the BPM6 template, offering a detailed view of current, capital,...
Visualizing India’s 50 Macroeconomic Indicators: A Comprehensive Dashboard
Explore India's macroeconomic trends with our interactive dashboard featuring data from the Reserve Bank of India.
RBI Ratios and Rates: Interactive Analysis with Forward Premia and Market Trends
This dashboard visualizes RBI's weekly financial data, covering various ratios, interest rates, and forward premia.
RBI’s Monthly Sale and Purchase of U.S. Dollars: Trends and Analysis
This dashboard provides a detailed overview of the Reserve Bank of India's (RBI) monthly sale and purchase of U.S. dollars.
Macro Economic Aggregates of India: Analyzing Growth Metrics at Current Prices
This dashboard provides a comprehensive view of India’s macroeconomic aggregates at current prices, allowing users to track and compare key...
Macro Economic Aggregates of India: Analyzing Growth Metrics at Constant Prices
This dashboard provides a comprehensive view of India’s macroeconomic aggregates at constant prices, allowing users to track and compare key...
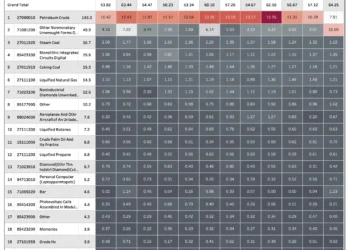
Indian Merchandise Imports by HSCode: Top Categories & Country-Specific Insights
This dashboard presents an overview of Indian merchandise imports categorized by HSCode, showcasing the top imported goods in billions of...
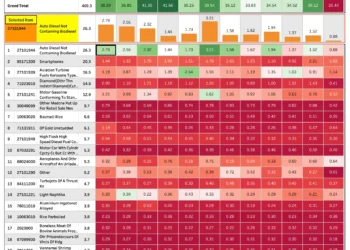
Indian Merchandise Exports by HSCode: Top Categories & Country-Specific Insights
This dashboard presents Indian merchandise exports categorized by HSCode, offering a detailed view of the top export categories in billions...


