Economics & Finance Data Stories
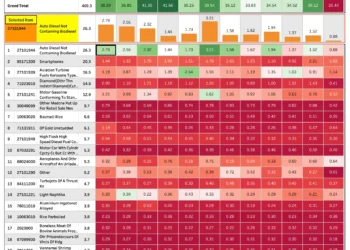
Indian Merchandise Exports by HSCode: Top Categories & Country-Specific Insights
This dashboard presents Indian merchandise exports categorized by HSCode, offering a detailed view of the top export categories in billions...
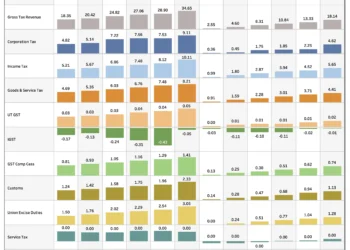
Government of India Tax Revenue Collections: Summary and Trends
This dashboard presents an overview of the Government of India's total tax revenue collection trends, segmented by different tax categories.
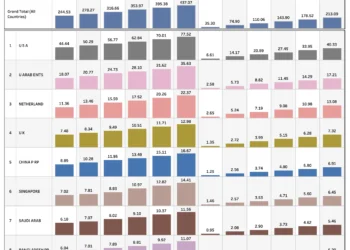
India’s Top N Trade Destinations: A Comprehensive View of Imports, Exports, Deficit, and Surplus
This dashboard provides a snapshot of India's aggregated trade with global partners, allowing users to explore top N countries by...
Consumer Price Index for Industrial Workers: All India & Selected Centers
Discover insights from our interactive dashboard showcasing the Consumer Price Index (CPI) for Industrial Workers across All India and selected...
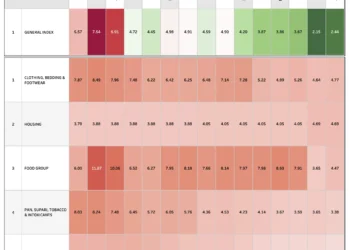
Consumer Price Index for Agricultural Labourers: Monthly Price Inflation Analysis (Base Year 1986-87)
This dashboard offers a comprehensive analysis of the Consumer Price Index (CPI) for Agricultural Labourers, based on the 1986-87 base...
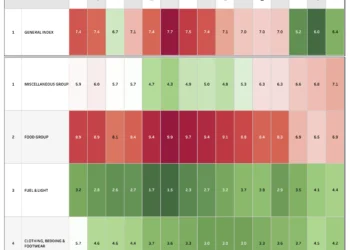
Consumer Price Index for Industrial Workers: Continuous Series Analysis (Base Year 2016 & 2001 Combined)
This dashboard provides a detailed view of the Consumer Price Index (CPI) for Industrial Workers, seamlessly combining data from two...
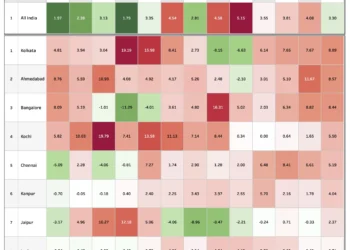
House Price Index & Inflation Trends: A Deep Dive into Major Indian Cities (2010-2011 Base)
This detailed visualization highlights the shifts in housing prices and inflation rates
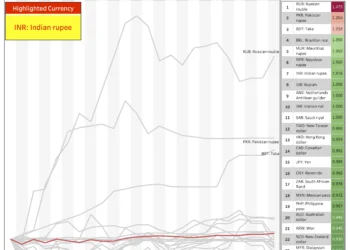
Global Currency Trends: Comparative Analysis Against the US Dollar
This chart, sourced from the Bank of International Settlements, offers a comparative view of currency movements relative to the US...
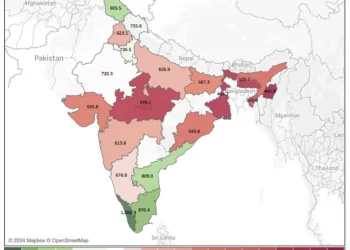
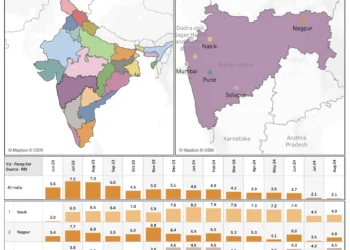
Wage Landscape: Interactive Map of Daily Wages for Rural Indian Men
Explore our interactive map detailing the average daily wage rates for rural Indian men, updated to the latest available data.

A Monthly Overview of Top 30 Company Groups’ External Commercial Borrowings
Explore the monthly trends in External Commercial Borrowings (ECB) for the top 30 company groups, visualized in a clear and...