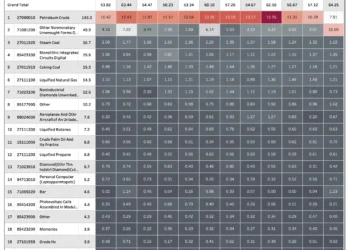
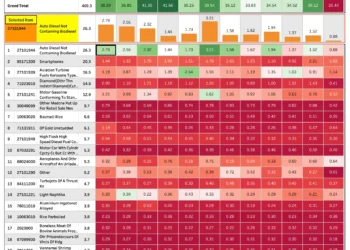
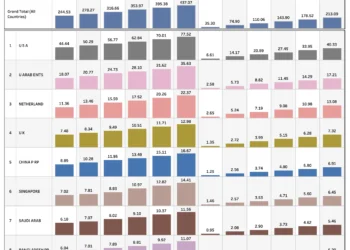
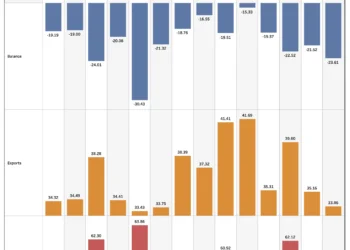
This visualization presents a monthly analysis of India’s trade in goods, categorized into energy (oil) and non-energy (non-oil) items. It allows users to explore exports, imports, and trade balance across different time scales, including monthly, quarterly, and yearly views.
Click here for a chart demo


