CPI Inflation Dashboard (Base Year 2024)
Explore Item-Level and State-Wise Inflation Using Official CPI Data To use this interactive dashboard, you will need the raw CPI ...
Explore Item-Level and State-Wise Inflation Using Official CPI Data To use this interactive dashboard, you will need the raw CPI ...

This visualization analyzes the Nominal and Real Effective Exchange Rates (NEER & REER) of global currencies across Broad (64) and ...
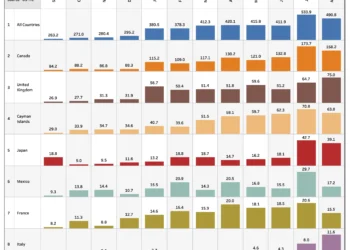
This interactive dashboard presents data from the U.S. Treasury International Capital (TIC) SLT Table 4, offering insights into cross-border purchases ...
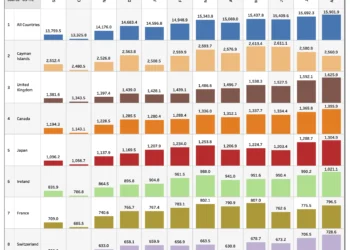
This interactive dashboard presents a detailed view of U.S. Treasury securities held by foreign residents, using data from the U.S. ...
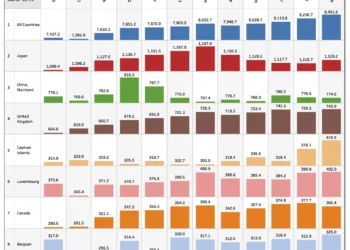
This interactive dashboard presents the U.S. Treasury International Capital (TIC) SLT Table 2 data, showcasing the foreign long-term securities held ...
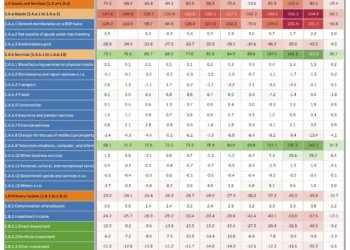
This dashboard presents India's Balance of Payments (BoP) as per the BPM6 template, offering a detailed view of current, capital, ...
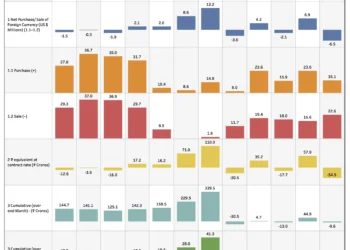
This dashboard provides a detailed overview of the Reserve Bank of India's (RBI) monthly sale and purchase of U.S. dollars.
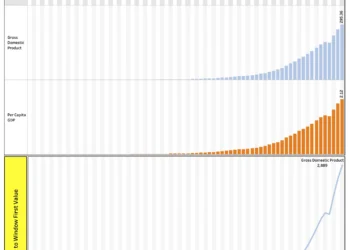
This dashboard provides a comprehensive view of India’s macroeconomic aggregates at current prices, allowing users to track and compare key ...
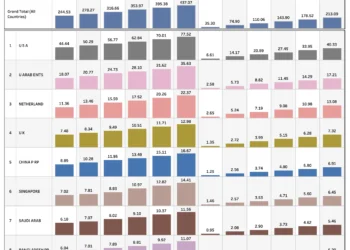
This dashboard provides a snapshot of India's aggregated trade with global partners, allowing users to explore top N countries by ...
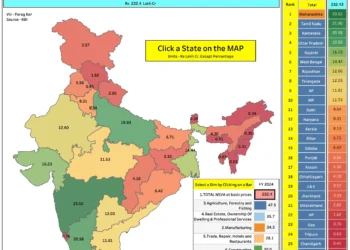
This dashboard presents the net Indian states value added by economic activity across India using current prices.