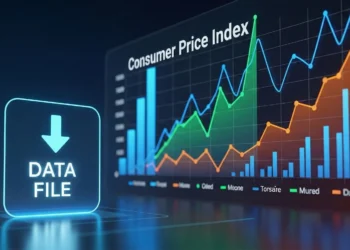
CPI Inflation Dashboard (Base Year 2024)
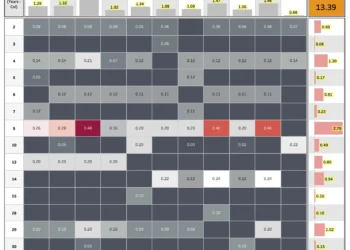
Explore Item-Level and State-Wise Inflation Using Official CPI Data To use this interactive dashboard, you will need the raw CPI ...
Explore Item-Level and State-Wise Inflation Using Official CPI Data To use this interactive dashboard, you will need the raw CPI ...
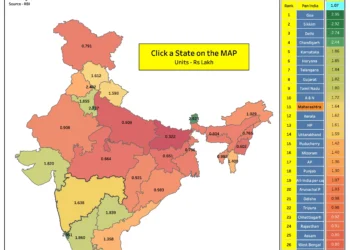
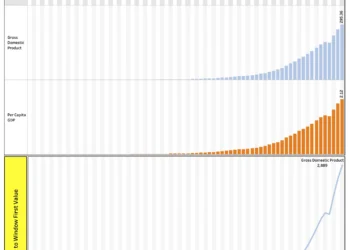
This interactive dashboard highlights the Per Capita Net State Domestic Product (at Constant Prices) across Indian states. Users can navigate ...
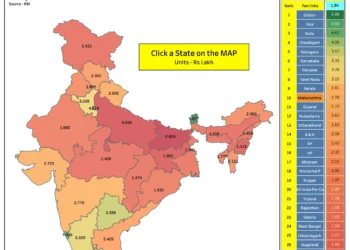
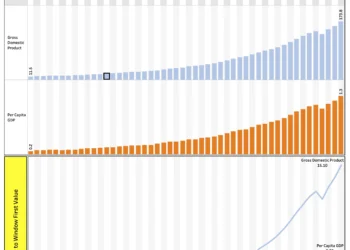
This interactive dashboard visualizes the Per Capita Net State Domestic Product at Factor Cost (at Current Prices) across Indian states. ...
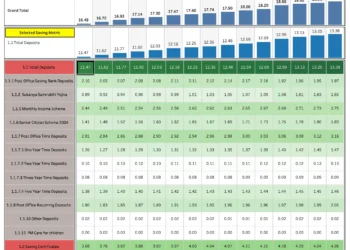
Explore a detailed visualization of Indian small savings data, including total savings, heatmap insights, and breakdown by different saving items, ...
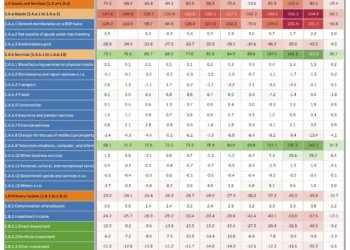
This dashboard presents India's Balance of Payments (BoP) as per the BPM6 template, offering a detailed view of current, capital, ...
Explore India's macroeconomic trends with our interactive dashboard featuring data from the Reserve Bank of India.

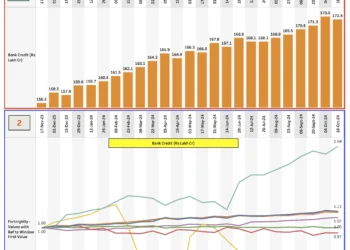
This dashboard visualizes RBI's weekly financial data, covering various ratios, interest rates, and forward premia.
This dashboard provides a comprehensive view of India’s macroeconomic aggregates at current prices, allowing users to track and compare key ...
This dashboard provides a comprehensive view of India’s macroeconomic aggregates at constant prices, allowing users to track and compare key ...
Dive into the intricacies of the Central Government's market borrowings with a detailed monthly breakdown of notified amounts and maturity ...